A Different kind of Technical Analysis about Gold; adjusted with Gareth Soloway:
I have been watching a technical analysis video at Kitconews Youtube channel, The analyst was Geareth Soloway invited by Kitconews, Gareth describing his technical analytical philosophy about Gold, silver, copper, BTC, S&P, Amazon, Apple, Palantir etc. in his screen with Candlestick Chart. Few days later he also share the same Gold analysis in his personal Youtube channel. I found when he was showing his analysis about Gold; was describing a very interesting kind of technical analogy in candlestick chart for two different time period. He have been in weekly chart and there was two window in his chart, one is end of 1979 and one is nowadays end of 2025 chart. I just impressed after watching this analysis and I immediately jump on gold chart to play with this kind of hot analogy and what I found is that you would probably love if you are really involve with Gold ann believe in Gold.
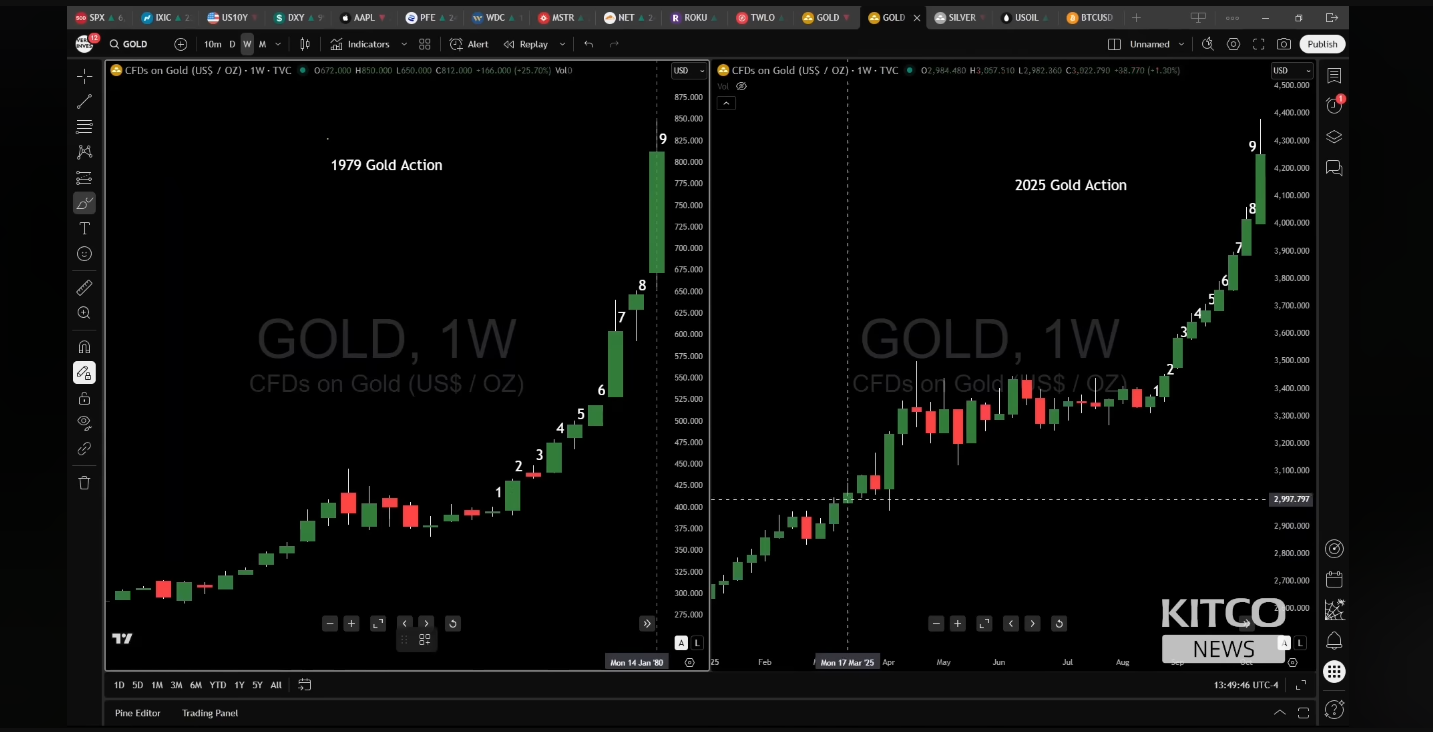
Let’s talk about what Gareth Showed:
Look at the chart there are exactly 9 bullish candle in both situation after a little bull move and side wise consolidation. And when the consolidation level break with bullish candle there is no bear candle till next 9 candle. Look what happen in 1979’s chart exactly end of 9th candle and starting of 10th candle market down to a crazy bearish up to previous swing high (from where first candle of Nine was started), in 1979 which he showed with a horizontal ray. Now look at the 2025 chart market is exactly same situation technically and its going down to touch previous swing high’s horizontal line from where 9 candle movement starting, just like 1979. In both situation a up movement, little side wise consolidation, 9 bullish candle and from 10th candle market is going down to its correction. According to this analysis market should down around $3500/$3600 level before crossing latest higher high and to start another bull run to $5000. Although he is bullish side of gold long time but he always introduce himself as a technician that’s why as a technician it’s alright to take advantage of bearish move by shorting. He also were talking about the de-dollarization movement, huge debt of federal reserve, and a probable bad future of fiat currency). I’m also bullish side of both gold and silver but market needs correction before going just straight bullish. Gareth says people are very obsessed with one of the easiest trade which is execute long trade in gold but market has its own weird way to out most of them before starting a new al time high. And we all know that fact. I really found my philosophy about this analysis is pretty similar with Gareth.
What I found about this technical analysis in the same chart:
I found that bearish movement after 9 candle strong bullish is repeating several time in the history of gold weekly chart. Similar behavior of market repeated in 2009, 2011 and also in 2020. And now in 2015 that similar thing most probably trying to happening again. And me as a analyst I also believe market most probably going to make that analogy true again. Donald Trump’s Tariff dividend announcement indicating a tariff recognition long time by not only Govt. but also citizen. Which Can drive USD bullish for a certain period of time, and that can help to make this analogy true again with 2025. Let’s break down one by one.
2009's Nine Candle Magic:
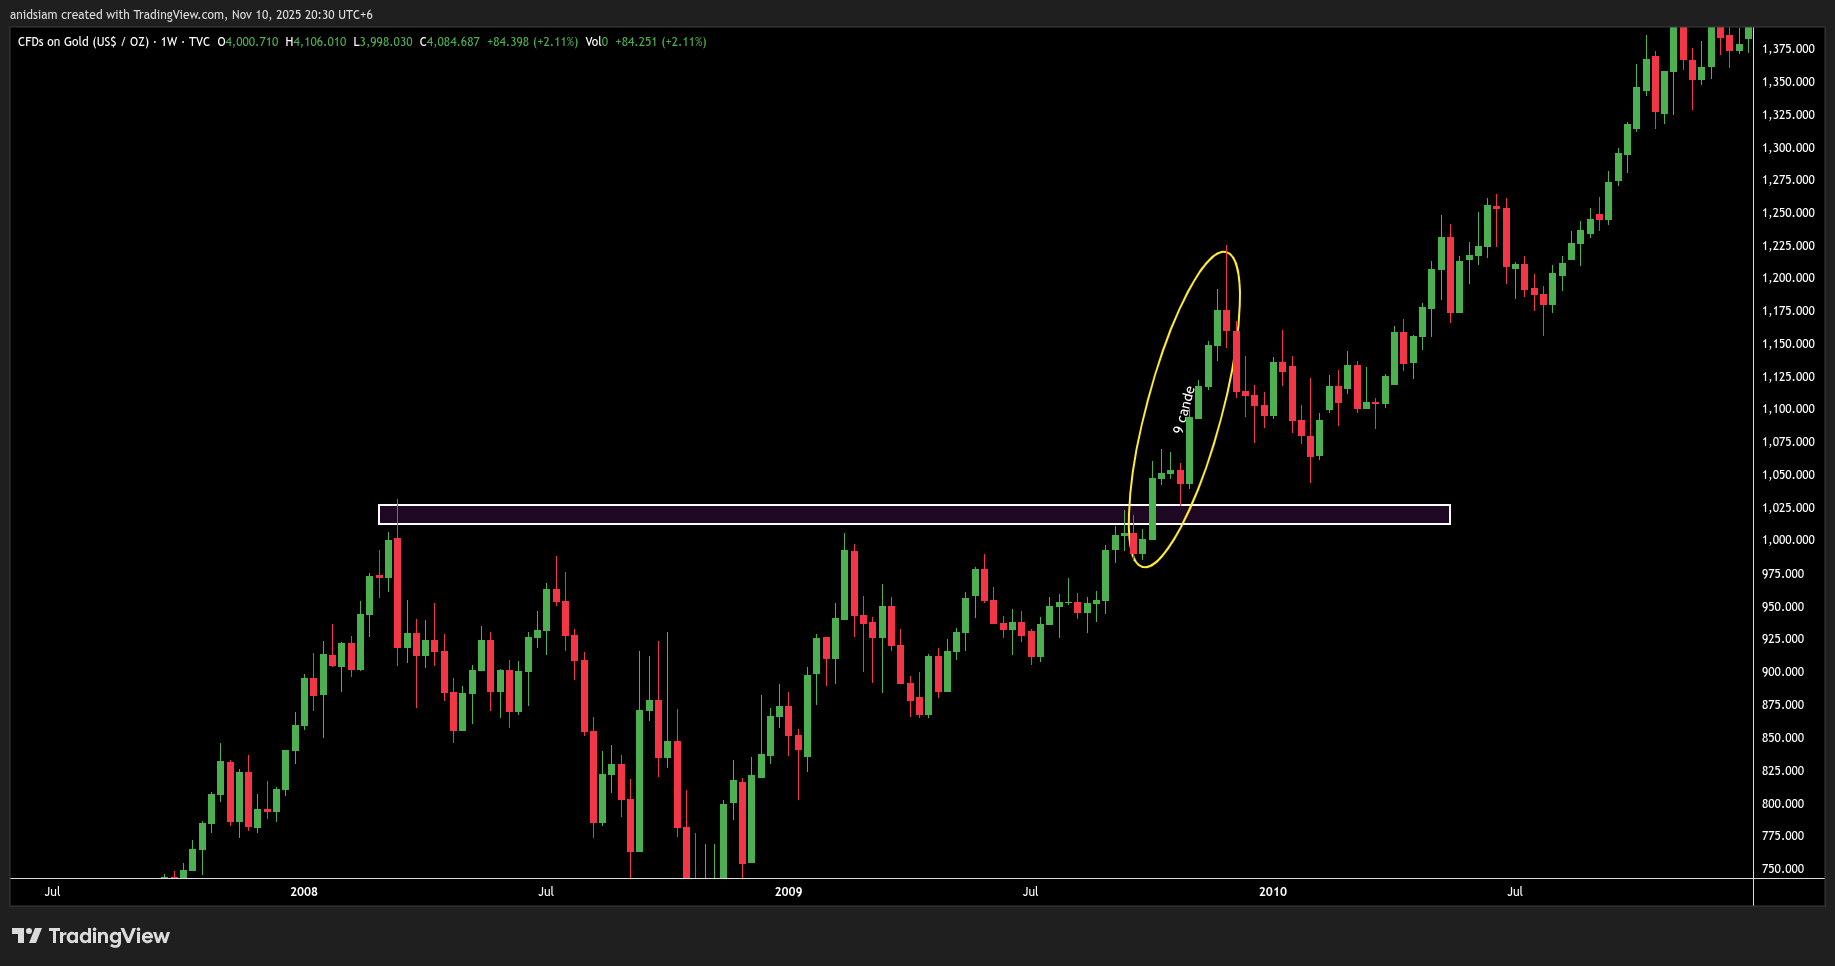
At the end of the 2009, Look at the chart before going another all time high; Price was consolidating around the rectangle I draw. This consolidation broke by a strong bullish candle and It’s make exactly 9 bullish candle to make a new higher high which was also all time high (Similar situation like 1979). After the end of total 9 bullish candle market made bearish move from 10th candle. And its gone back to near previous swing high support from where nine candle were starting. And then beginning another crazy bullish movement again to al time high. Which is Similar scenario with 1979. And probably this things happening again with end of 2025 according to Gareth.
2011's Nine Candle Magic:
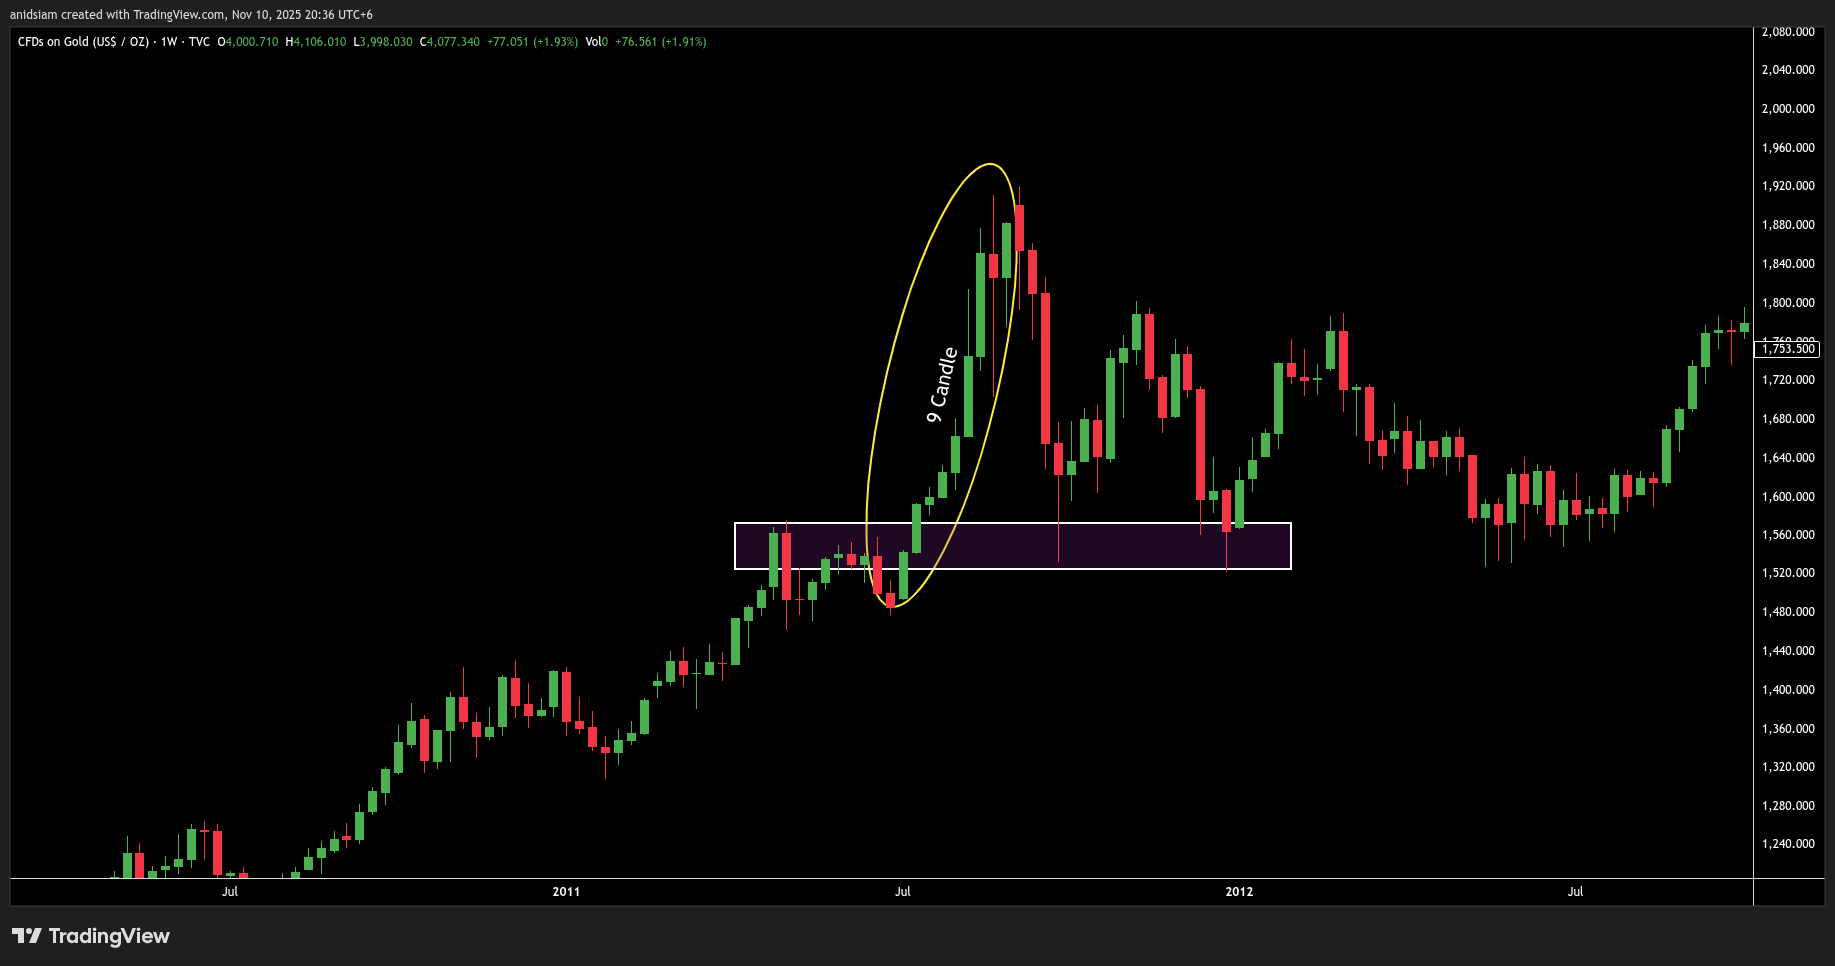
In 2011 the price repeat the same scenario again. Little side wise consolidation in May and June and In July the consolidation movement is broke by two strong bullish candle and look at the bullish movement, there are nine candle behind the crazy bullish movement. After the end of none candle the bearish candle and movement is stated and come back at the zone from where first bullish candle of nine was started. Which is exactly the same scenario with 1979 and 2009. And now the pattern is stronger than 1979 and 2009 because double bottom is appears break the latest high and starting new all time high. If I summarize the analogy again: A little up move, side wise consolidation, exactly 9 candle bullish movement and then going back to the previous swing high from where 9 candle started and after touching that level market had gone it’s own way of new all time high.
2020's Nine Candle Magic:
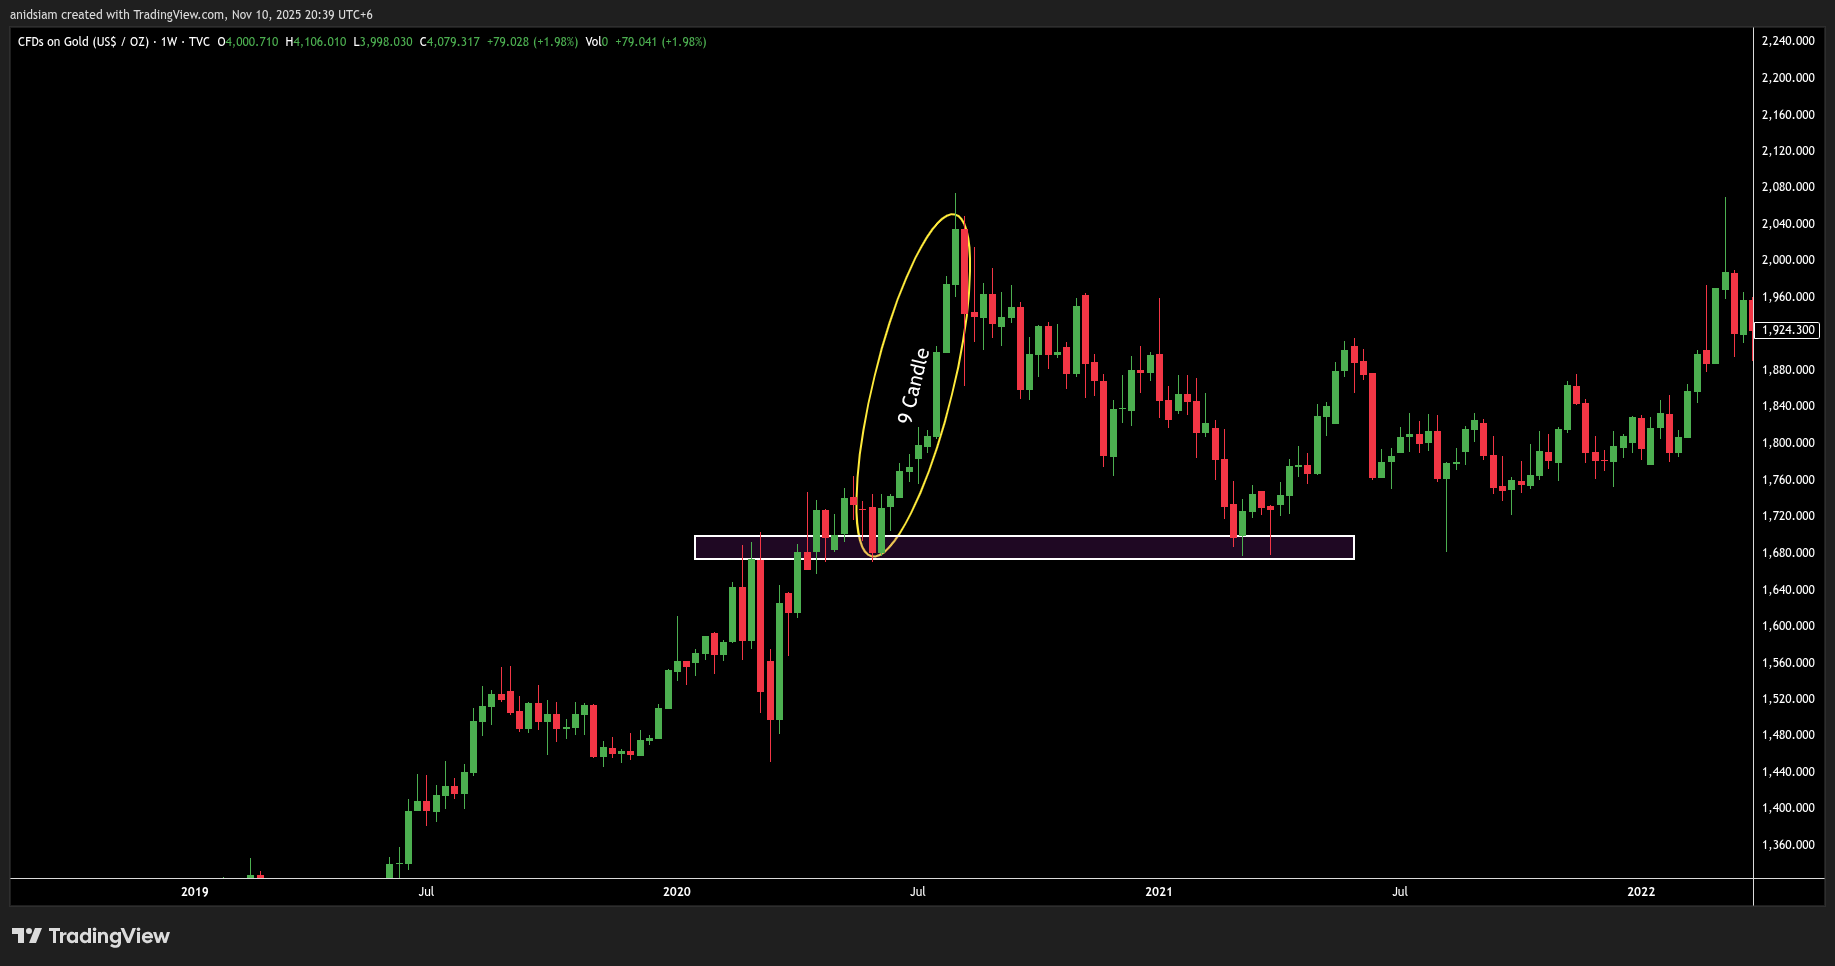
Again, on 2020’s May, June, July, August look at Gold weekly chart. Exact same scenario happened in the price chart. Little side wise consolidation after a bull move which I show in the above chart with a rectangle, One candle break the level and make a sharp edge bullish move through 9 amount of weekly candle like 1979, 2009, 2011. Look how crazy bear candle structured (which is 10th candle) end of 9th. Price going back to the level from where the 1st candle of nine was started just like the magic (technical analyst may say this level as order block level). After touching that zone Price has repeat its character to make upper movement to break latest high and make new all time high.
N.B. Trading or Invest in any Asset include some risk of your capital, if you are not familiar with manage those risks, You are not ready yet to trade/invest. Remember one thing always “If you want to invest $1 million; You should have your own knowledge Worth of $10 Million”.
If you found value and like this analysis and wanna get more analysis every week, Then you can consider to Subscribe Finovatic